Course Performance Analysis - Machine Learning and AI Strategies
Oct 09, 2024
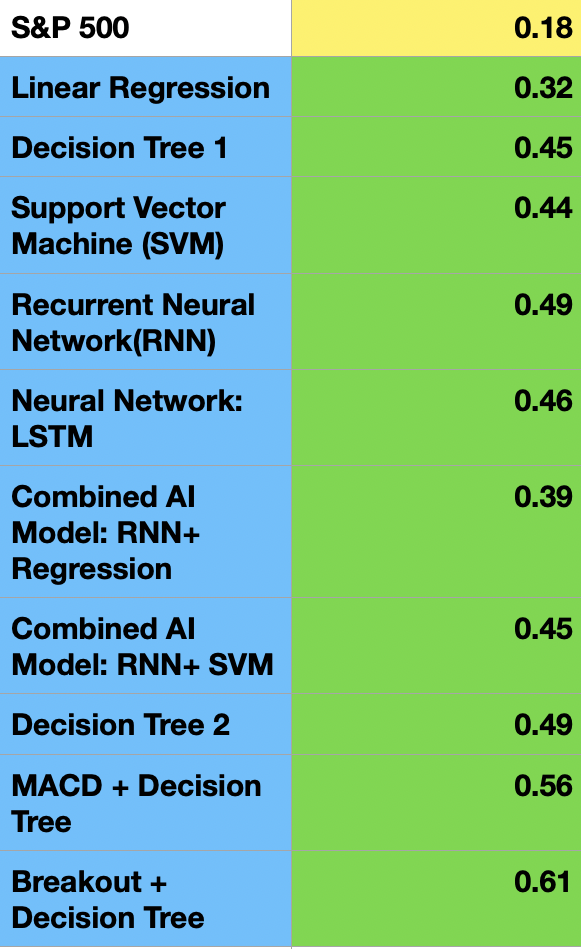
All tests have been done on testing data. We have used CAGR to Maximum Drawdown to S&P 500 as the comparative performance measure. You can read our blog article on "Why not to use Sharpe Ratio for performance measure and why to use CAGR/Max DD ratio."
CAGR of S&P 500 for the past 50 odd years has been 10%. With maximum drawdown of 55%(Global Financial Crisis Crash in 2008). Hence the ratio being 10/55 = 0.18. Our goal as quants is to beat this ratio. All our strategies have beaten this ratio at the creation of the strategy. Screenshots of the results below.
Linear Regression

Decision Tree

Decision Tree 2

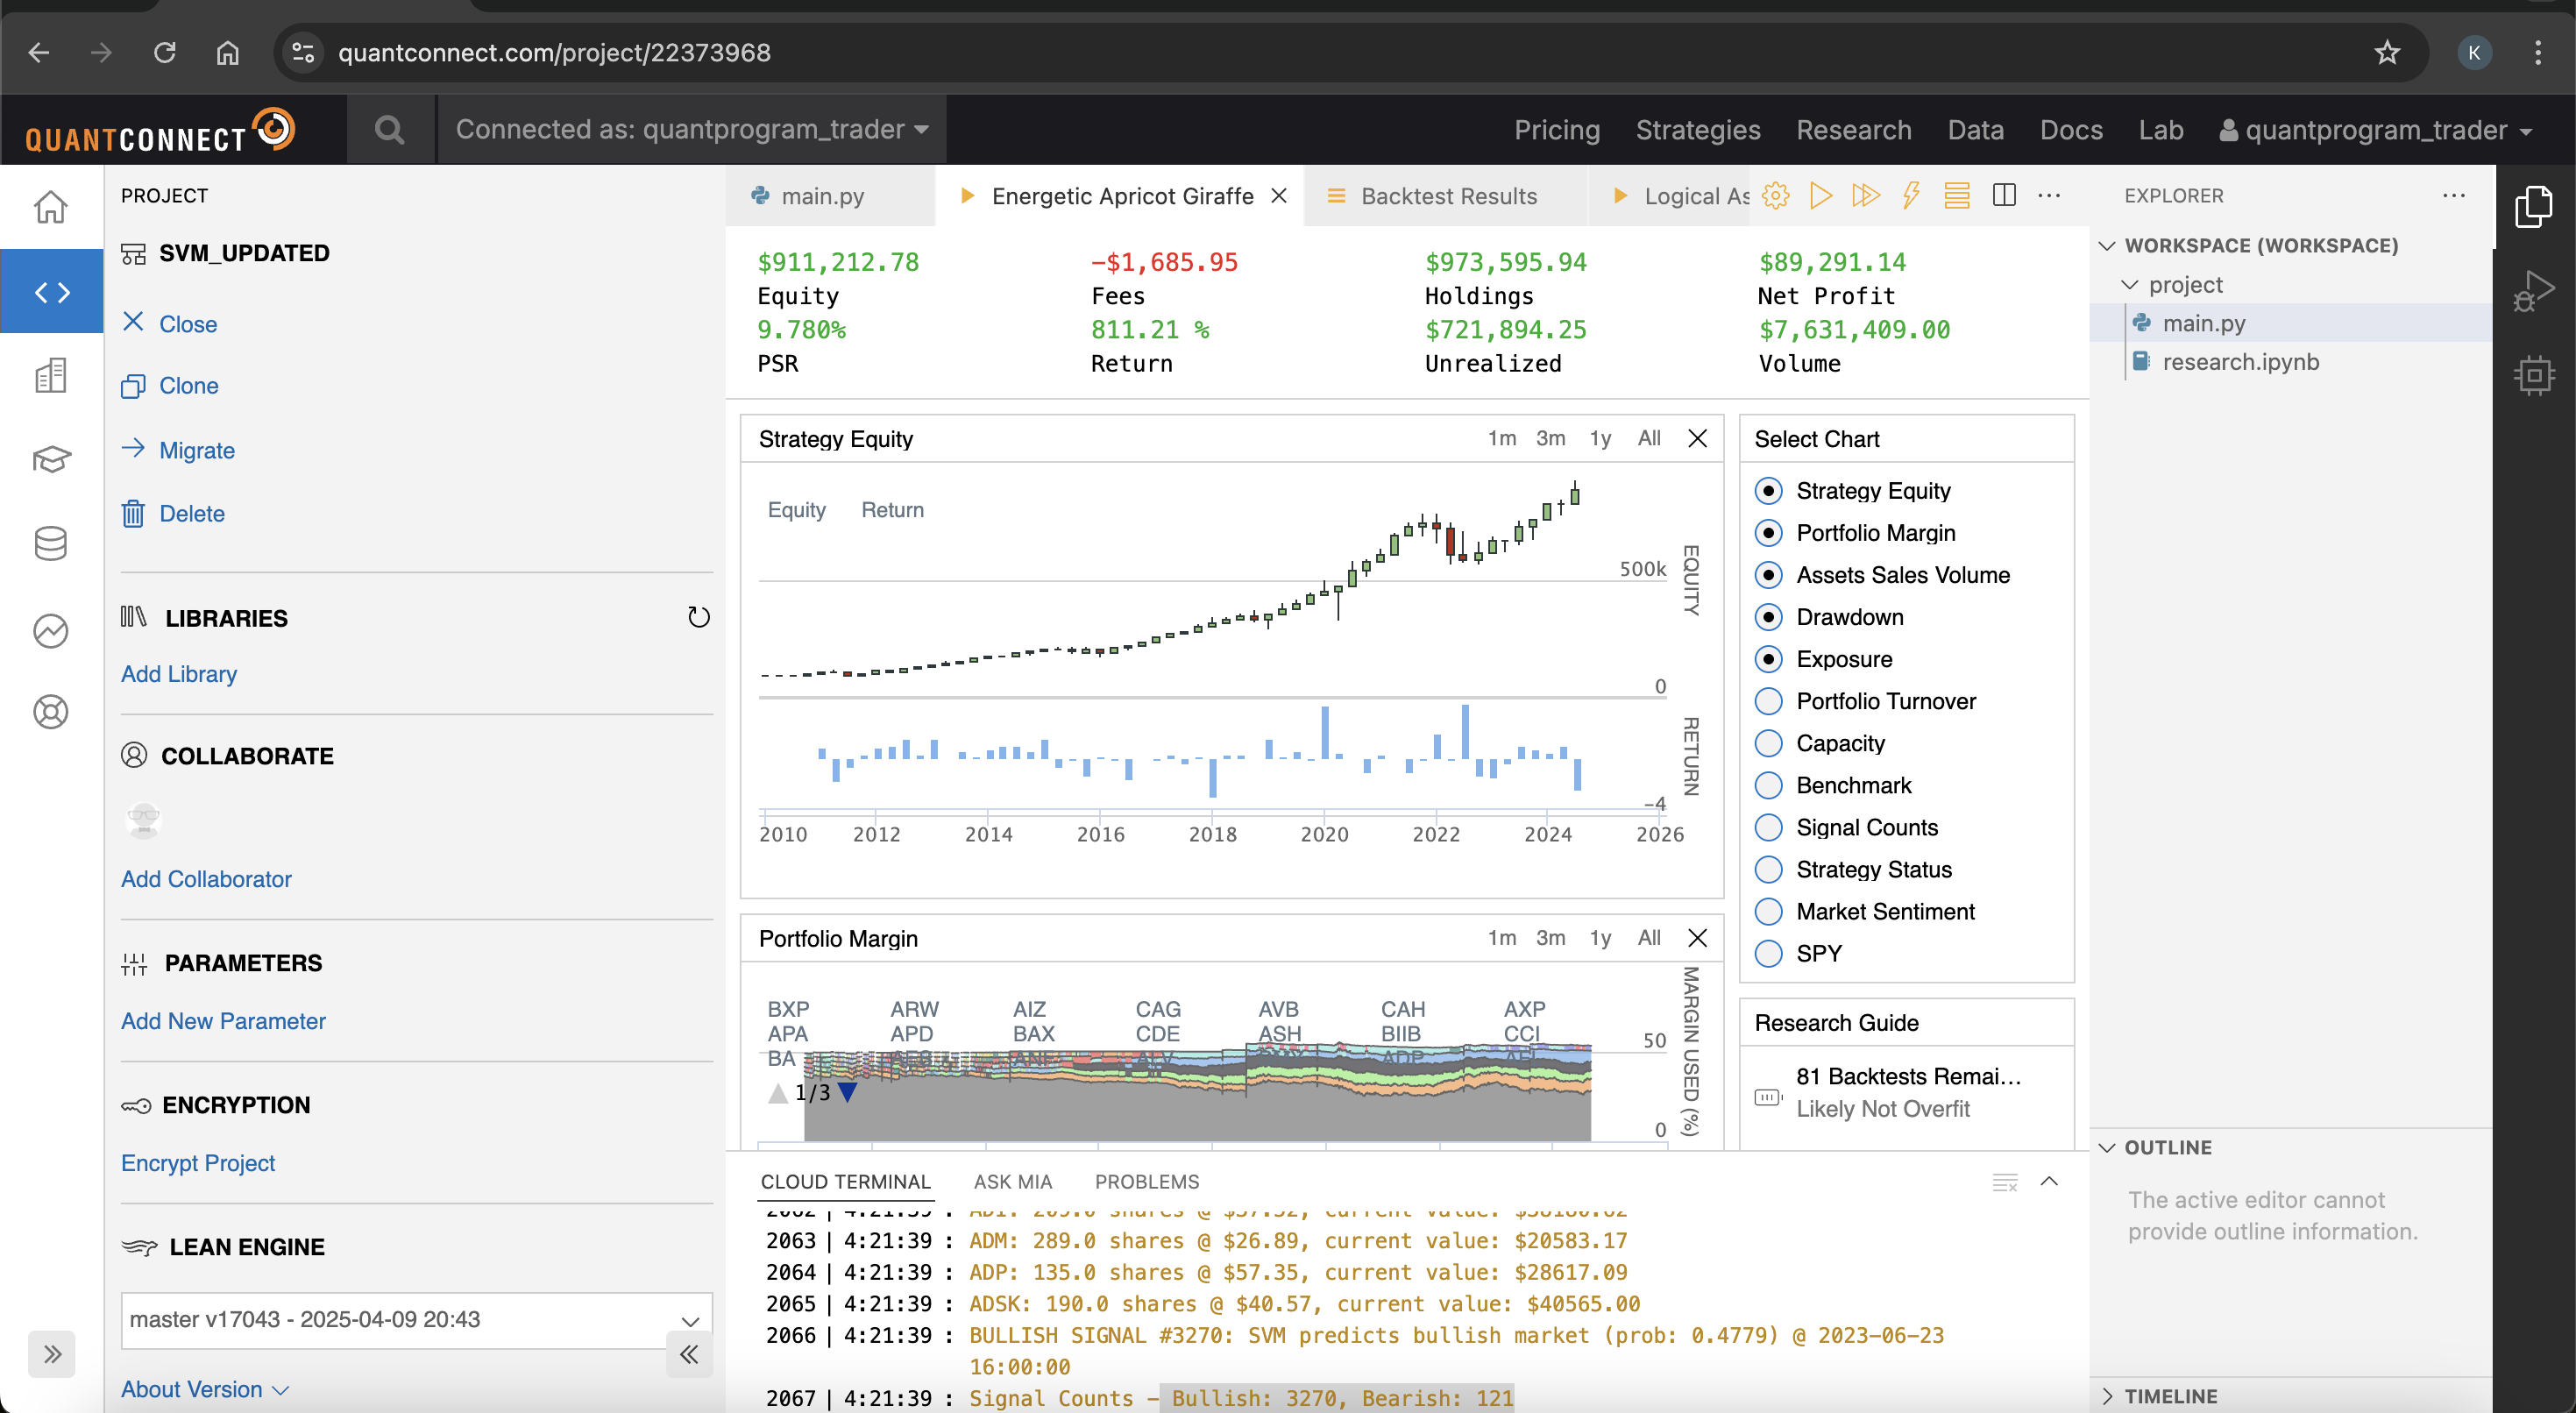
Support Vector Machine
Recurrent Neural Network

Long Short Term Memory

Combined AI Models: RNN+ Regression

Combined AI Models: RNN+SVM

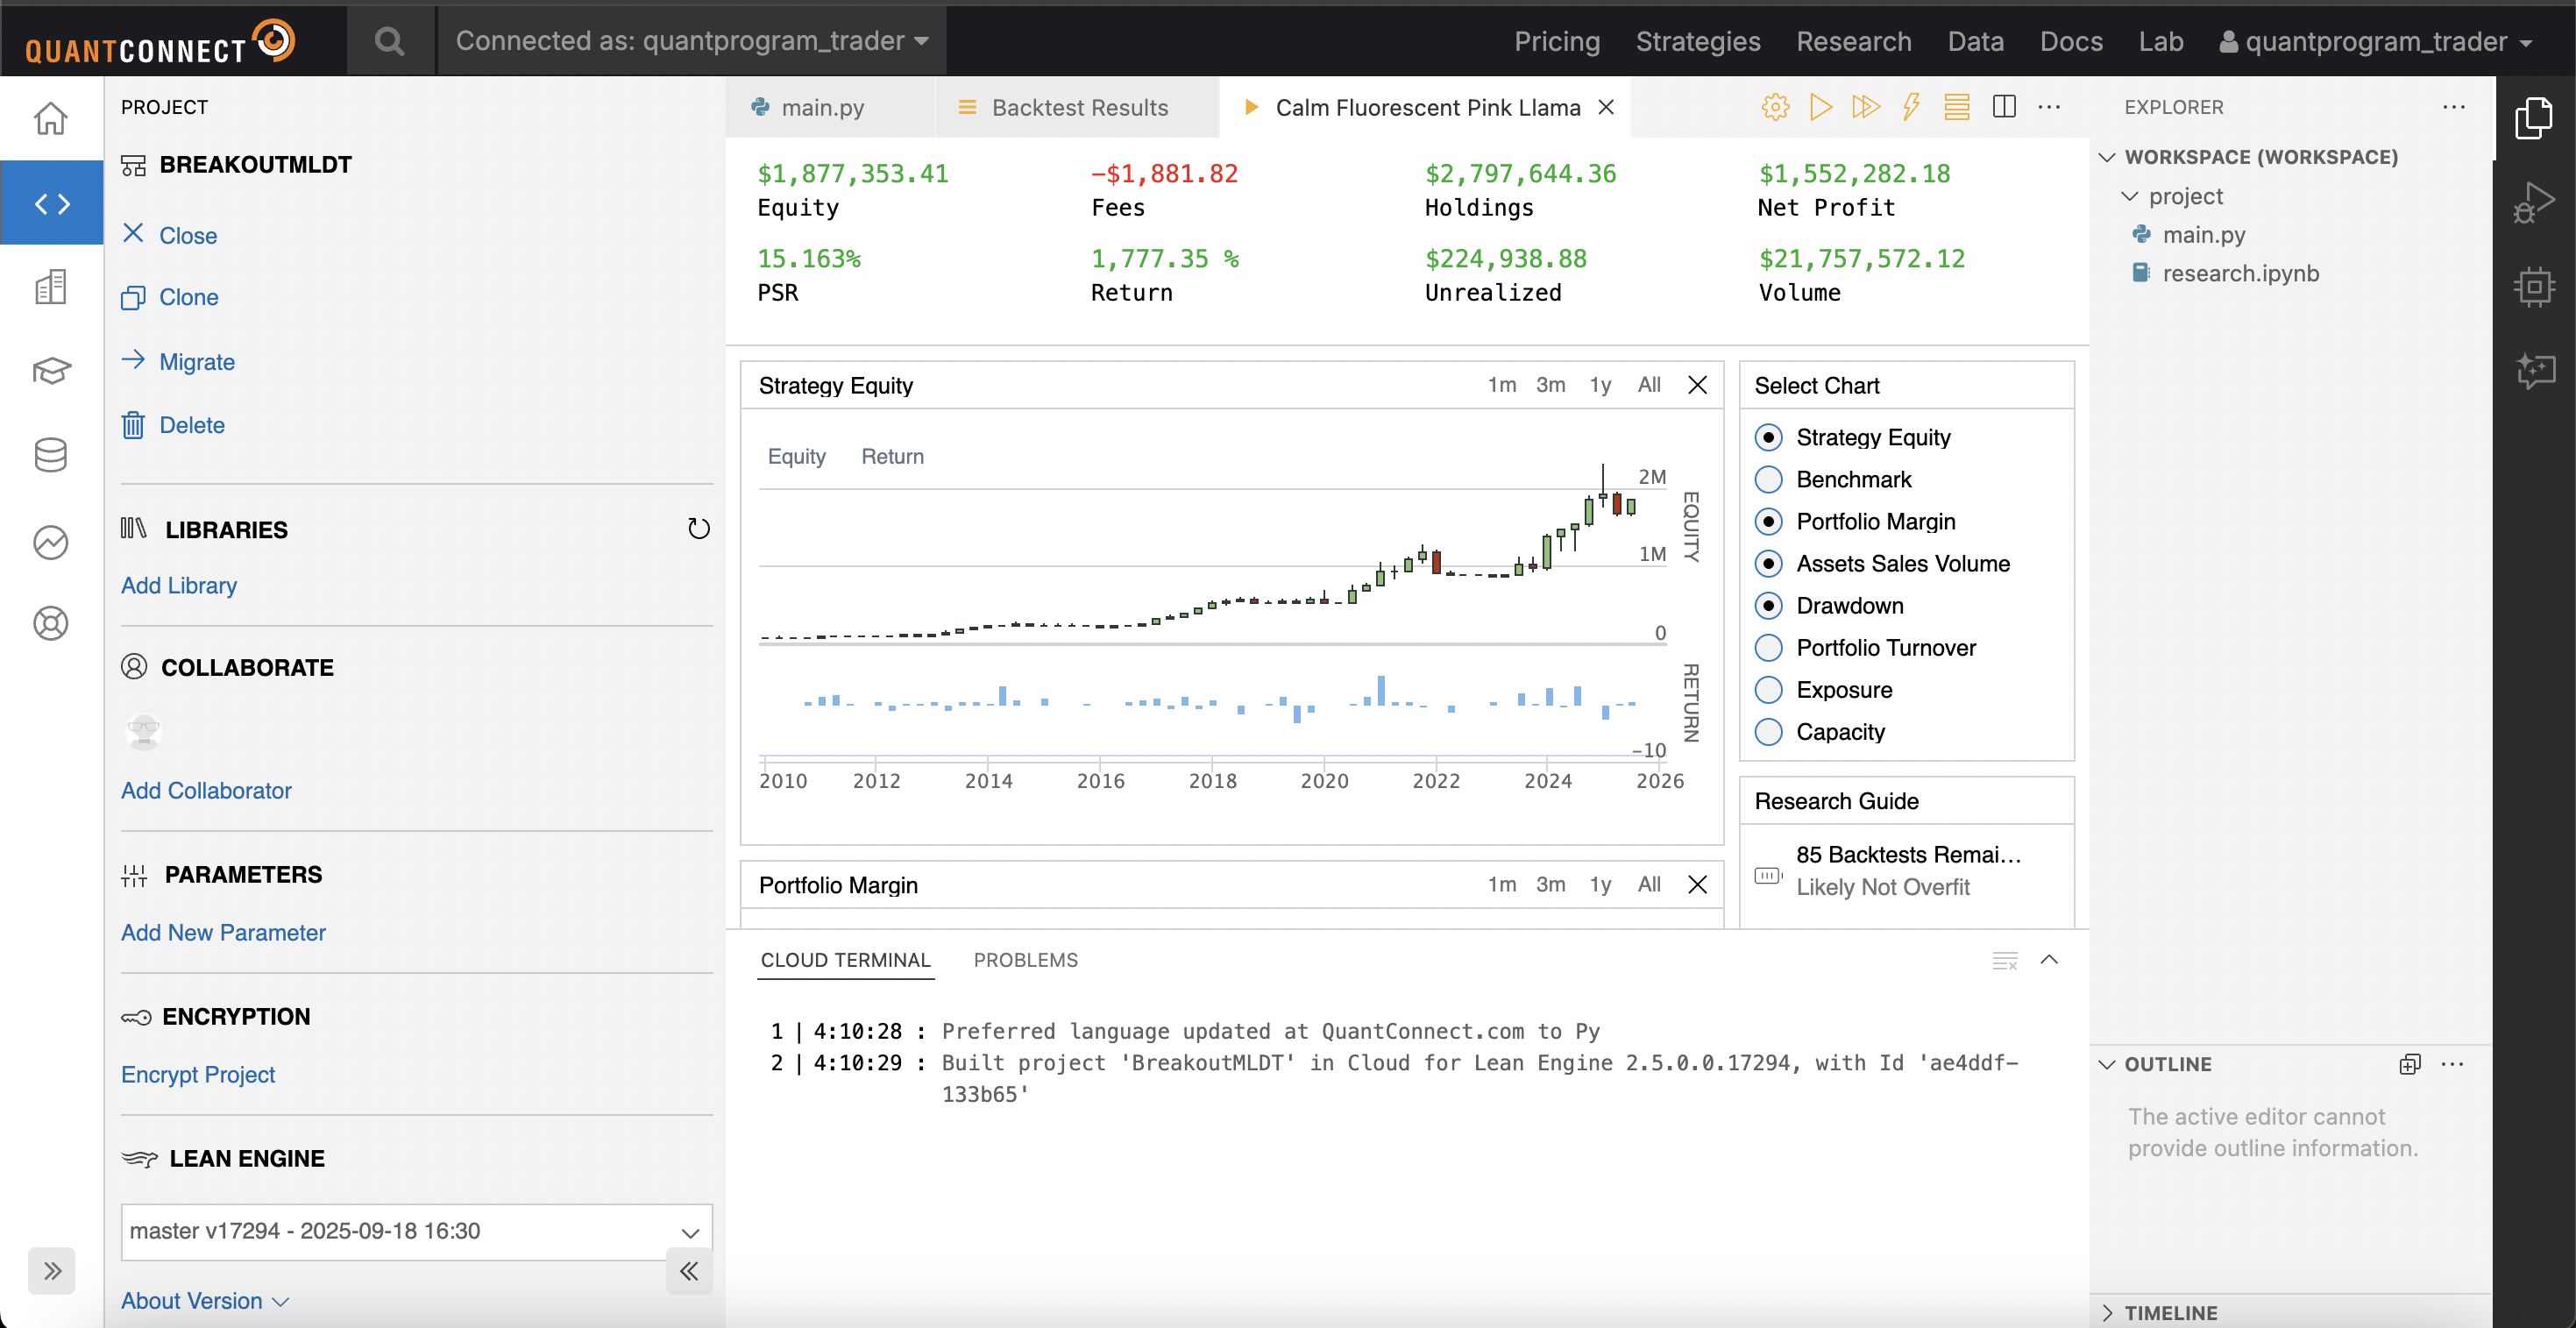
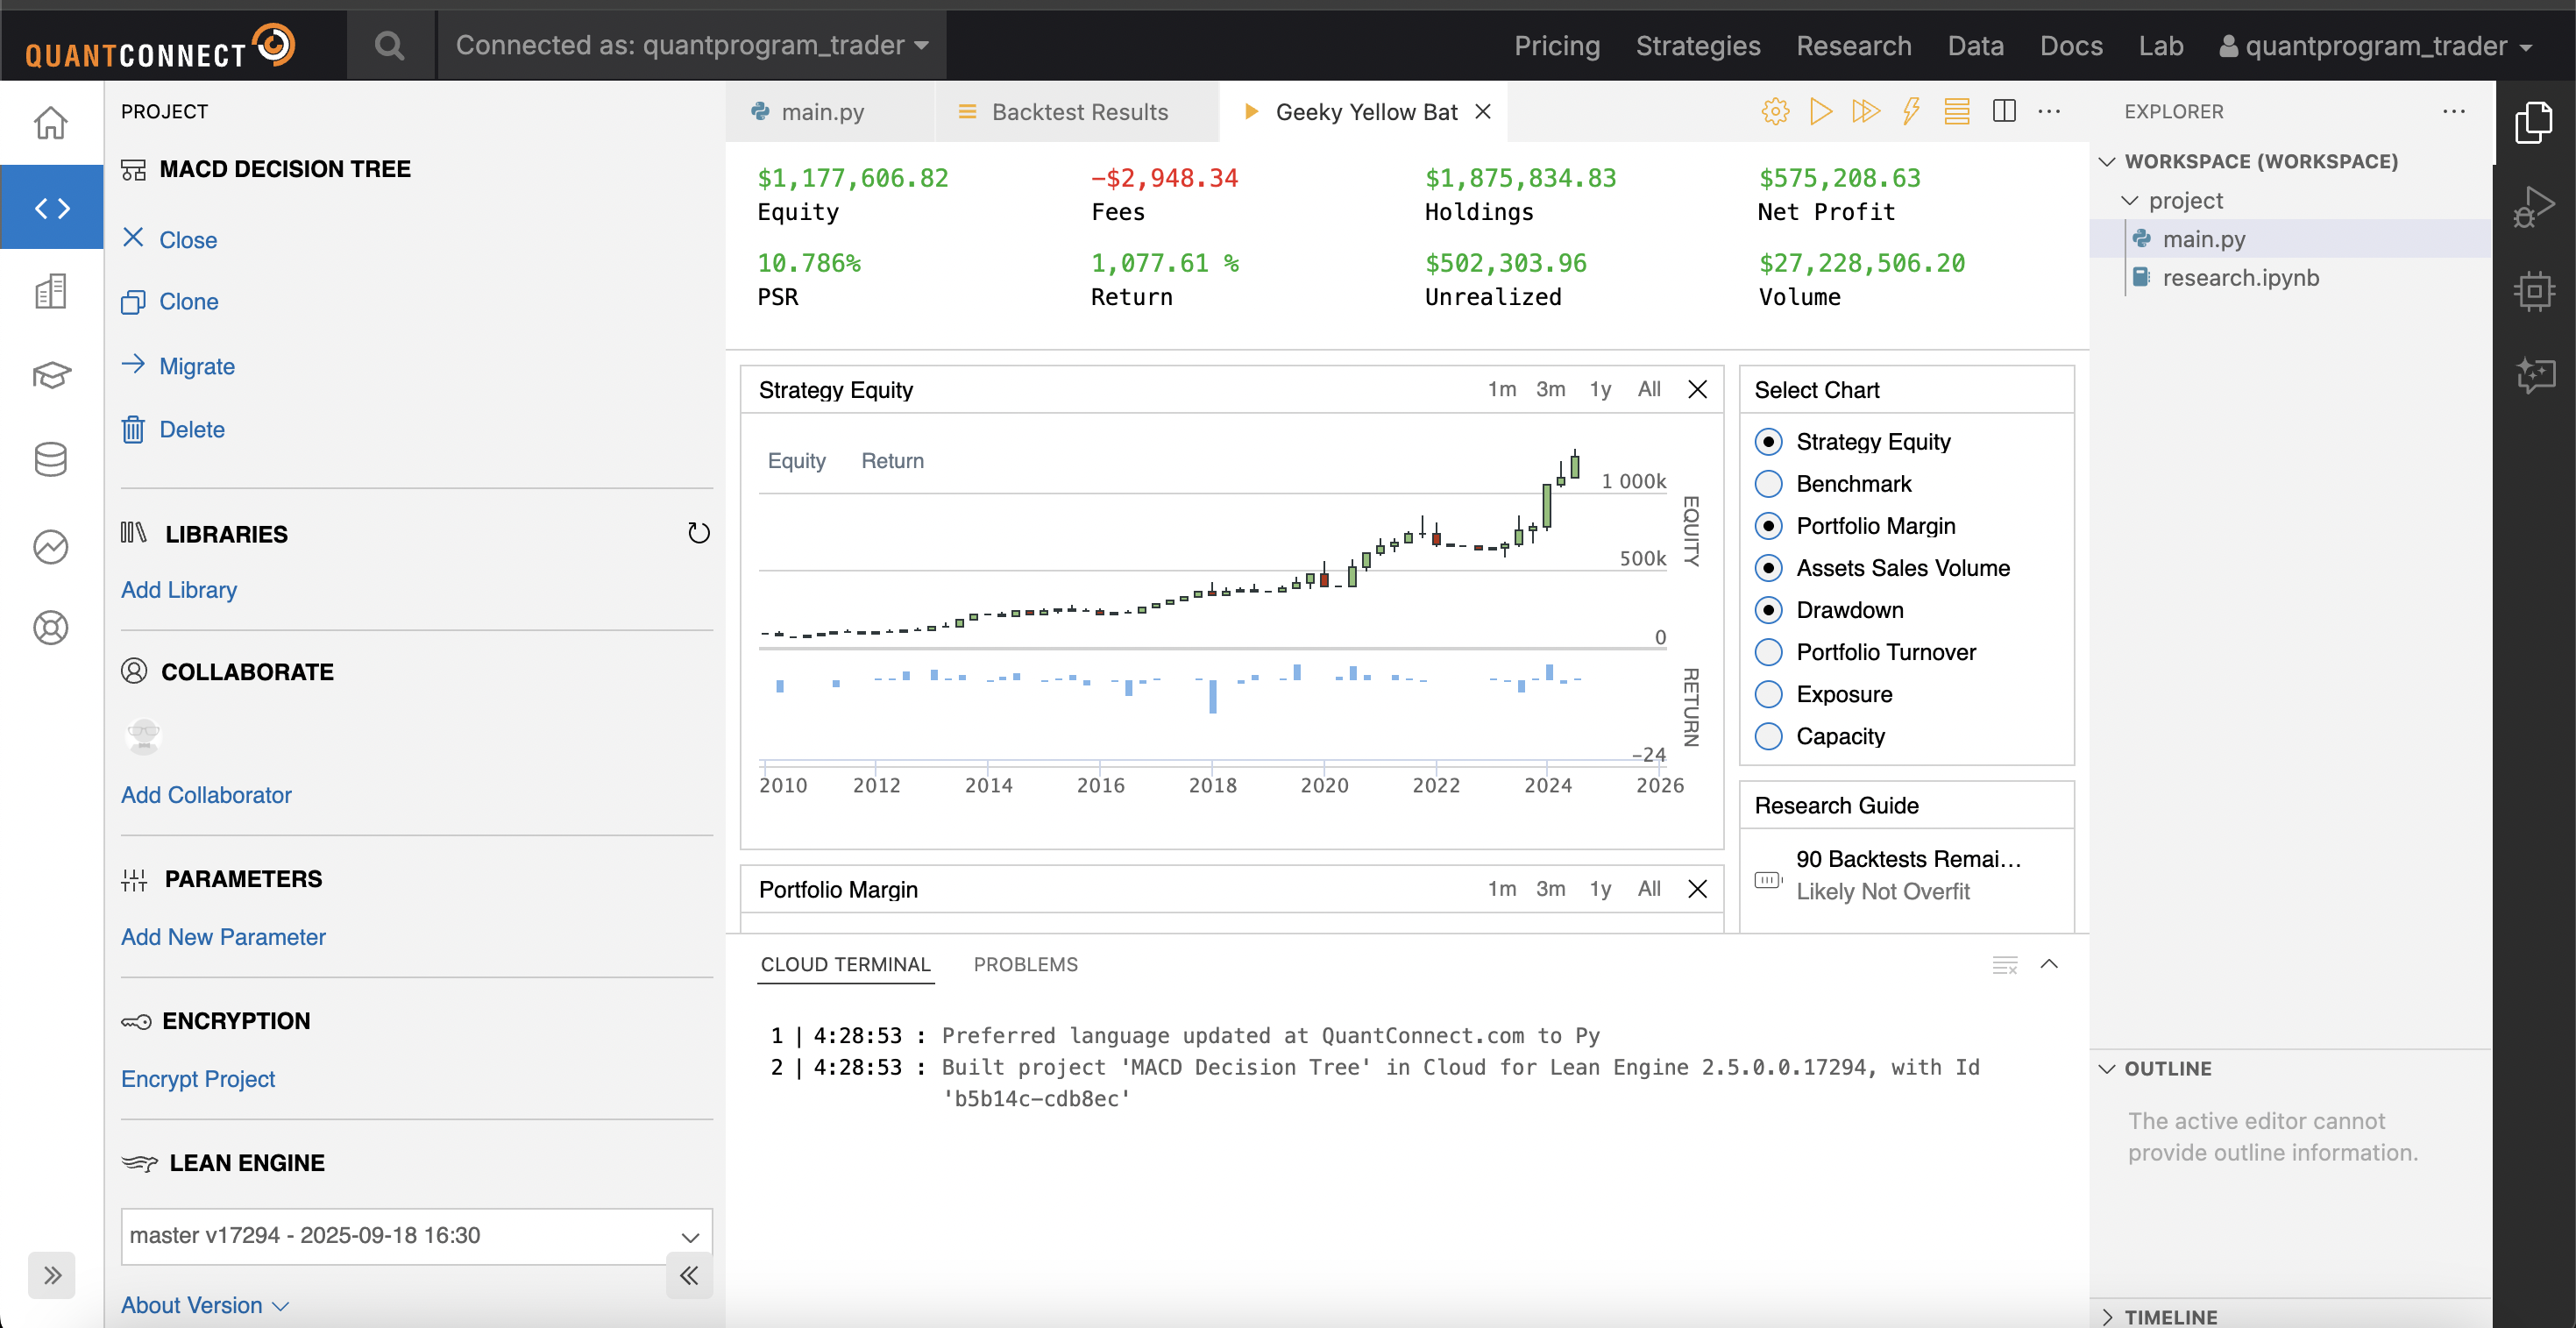
MACD + Decision Tree
Breakout + Decision Tree